Sunday, August 26, 2012

Oldtown EOD 24/8/12


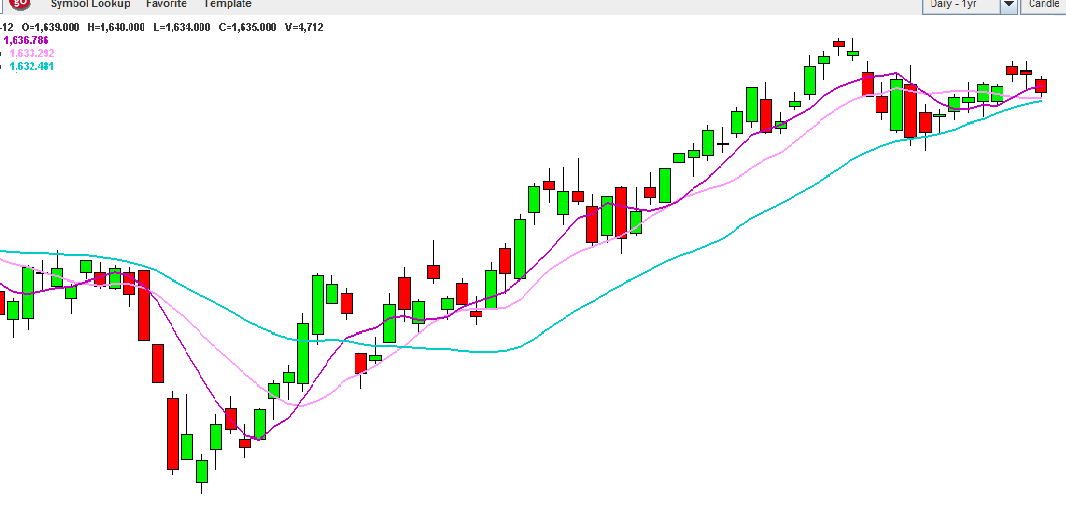
Will Oldtown be able to continue its upside momentum with the last doji candlestick closing on Friday?

Is it gonna be forming another new historical high soon? Let's watch if it breaks this level 227 successfully and run beyond the number of 233 next week?
How far can it go anyway? 

Support @ 220 - 205
Resistance @ 227 - 233


AT EOD 24/8/12


AT - Is it for real this time? Has it waken up from its long long sleep?

Will its history be happening again? Breaking past its 315 cts level? Or will it be giving us another false hope?

Support - 17 - 16
Resistance - 215 - 24


SKPetro EOD 24/8/12


SKPetro - When will it be coming? It has happened a couple of times trying to breach this level of 250, however each time it just couldn't managed to break past and stay above this level.

The same thing happened on last Friday closing as well, it managed to close only at 247 level, with a volume which is low, as usual. 

In my opinion, volume has to come in order for it to spike higher, otherwise nothing much to look at for now. 

Support - 2.45 - 2.40
Resistance - 2.50 - 2.59

Canone EOD 24/8/12


Can the history of the same pattern be happening for Canone? 

Will it be rallying up soon touching its high of 3.13 again?

Support - 2.64
Resistance - 2.93 - 3.02

Friday, August 10, 2012

Benalec EOD 9/8/12


In my opinion, this counter is worth monitoring. As there had been acquisation of shares by the directors within the range of 1.15 - 1.17 since months back.

It started to have some movement last two days, where it touched 1.23 highest before closing at 1.22. And the price went lower today and closed at 1.19, a red candle with a lower shadow. 

From its movement today, i did noticed some accumulation done at 1.19 - 1.18 level. I believe this counter should be making its move slow n steady, where it could have some possible spiking stages. 

Next level to aim for is at 1.24; to break above it successfully and we shall be able to see 1.30 soon after that. 

Thursday, August 9, 2012

FKLI for 10/8/12


Resistance @ 1645 - 51.
Support @ 1638 - 34.
Breakout level - 1640.


MKH EOD 9/8/12


MKH failed to break past its historical high of 2.67 the past two days. It went up to its highest of 2.65 and fell back lower to closing at 2.58.

Followed by the next day black candle and an inverted hammer today, which i suppose would not make any great indication of reversal for the coming days, as it is not at the bottom yet.

I am curious as to whether the price might go to as low as 2.38 support level? As it retraced from the top BB line last two days and closed below the mid BB line today. 

Let's watch its movement. 

I believe there might be some accumulation on going at the moment before getting ready for its next spike. 


MFlour EOD 9/8/12


Will MFlour be able to break past its barrier of 1.64? In my opinion, it needs to accumulate enough of volume in order to surpass this level which had failed to do so in the past one month. 

Today, we could see that it didnt managed to break thru that level as well, when it reached 1.64, within a couple of minutes it fell back lower to 1.63 and then 1.62. 

It closed above 1.60 lvl today and stayed at 1.62. How will it fare for tomorrow then?

Once it breaks above 1.64 barrier successfully, i suppose we would be able to see 1.70 soon!


Wednesday, August 8, 2012

FKLI for 9/8/12


Resistance @ 1640.5 - 45.5 - 48.5 - 1650.
Support @ 1632 - 27 - 22.

DJIA + 20.28 pts / + 0.15% as of 11.17pm.

KLCI 2011 vs 2012


Just for reference of pattern.

Comparing year 2011 vs 2012. 

The pattern is slightly different comparing between 2011 vs 2012.

First fall Jan 2011, followed by April, July has the most drastic fall from 1596 level to 1310 in Sept 2011, where it finally U - Turn and moved upwards from 27 Sept 2011.

Where by, in 2012 first fall was in May 2012, only for a while to 1526, within a month and then it rallied up further all the way to 1646 around in July 2012, before retracing slightly now.


Tuesday, August 7, 2012

FKLI for 8/8/12


Resistance @ 1646 - 59.
Support @ 1636 - 32 - 25 - 19.5.
Breakout - 1638.

DJIA + 83.90 pts / + 0.64 % as of 11.54pm.

P/S : - I'm not too familiar with Fibonacci Tools, hence i'm not too sure if i did it correctly not? Pls comment if there is any mistakes or anything to add on / remove, etc....

*The figures for my resistances n supports are from my manual PNF chart.


Sunday, August 5, 2012

FKLI for 6/8/12


Resistance @ 1641 - 45.5 - 47.
Support @ 1632 - 28.5 - 23.
Breakout Point @ 1636.

DJIA + 217.29 pts / + 1.69% on Friday.