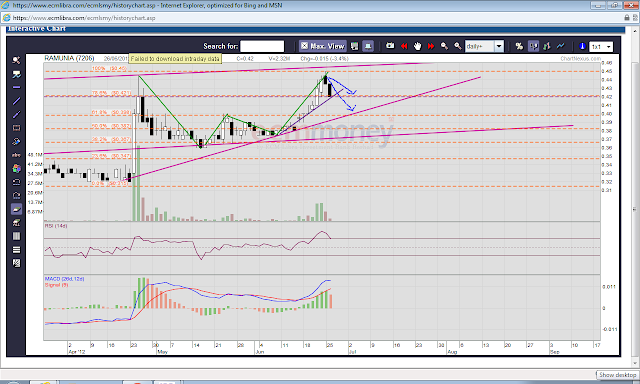
Ramunia has started to move lower, within these two days closing. From yesterday's closing of 0.435 and finally it ended @ 0.42 today.
Someone reminded me of its bearish signal for this particular counter, from the W shape which i draw in the chart. And at the same time, it is very at the overbought levels already, you could see its RSI turning down as well as the MACD line has started to look like its moving lower now, with its first red histogram seen from the indicator after so many days in the green.
Volume had also decreased since yesterday, with more sellers than buyers seen. And that gave two black candlesticks, with a black marubozu today. Will it continue to move lower then? As from what i have seen from its buy and sell Q's and transactions, the buyers didn't seem to be wanting to eat at a higher price though. And that brought a close of 0.42 instead of 0.425 where there were many lots waited to be sold here.
2 possibilities as of now; in my opinion, it might either stay sideways lingering around 0.42, or it will move lower to its next support of 0.398; around 0.40 level.
Will have to look at the demand tomorrow.
To all out there, what would be your view on this counter then? Feel free to share.
P/S : If there is an opportunity to take some profit, please do so, and find another chance to get in again. Just an advise. Otherwise, you could look at it for longer term, if you are well verse and confident with this company. It's just the time wasted with cash on hold to it to be exchanged with some other opportunities out there. :P
P/S : If there is an opportunity to take some profit, please do so, and find another chance to get in again. Just an advise. Otherwise, you could look at it for longer term, if you are well verse and confident with this company. It's just the time wasted with cash on hold to it to be exchanged with some other opportunities out there. :P

No comments:
Post a Comment